As an experienced crypto trader, I’ve witnessed firsthand the transformative power of the right trading indicators. When I first started out, the sheer volume of information and technical jargon surrounding crypto markets was overwhelming. But over the years, I’ve learned that by harnessing the true potential of the best crypto trading indicators, you can navigate the volatile cryptocurrency landscape with confidence and precision.
In this comprehensive guide, I’ll share the top 5 trading indicators that have been pivotal to my own crypto trading journey. Whether you’re a day trader seeking short-term opportunities or a long-term investor aiming to capitalize on emerging trends, mastering these indicators can be a game-changer in unlocking your crypto trading potential.
Understanding the Foundations: Technical Indicators in Crypto Trading
Technical indicators are mathematical calculations based on the price and volume data of a cryptocurrency. These powerful tools provide valuable insights into market sentiment, momentum, and potential trend reversals. By analyzing these indicators, you can make more informed decisions about when to enter or exit a position, ultimately enhancing your overall trading strategy.
There are various types of indicators, each with its own unique characteristics and applications. Trend indicators like Moving Averages help identify the overall market direction, while momentum indicators such as the Relative Strength Index (RSI) gauge the speed and strength of price movements. Volatility indicators, like Bollinger Bands, measure the degree of price fluctuations, while volume indicators analyze trading activity to confirm or contradict other signals.
The key to unlocking the full potential of these indicators lies in using them in combination. By analyzing multiple indicators simultaneously, you can confirm trading signals, identify potential divergences, and make more well-rounded decisions — a skill that I’ve honed over the years through extensive practice and experimentation.
Mastering the Best Crypto Trading Indicators: Top 5 for Beginners
Moving Averages: Identifying Trends with Clarity
The Moving Average (MA) is a personal favorite and one of the most widely used indicators in the crypto trading world. By smoothing out price fluctuations, MAs make it easier to identify the overall trend direction, whether it’s bullish, bearish, or sideways.
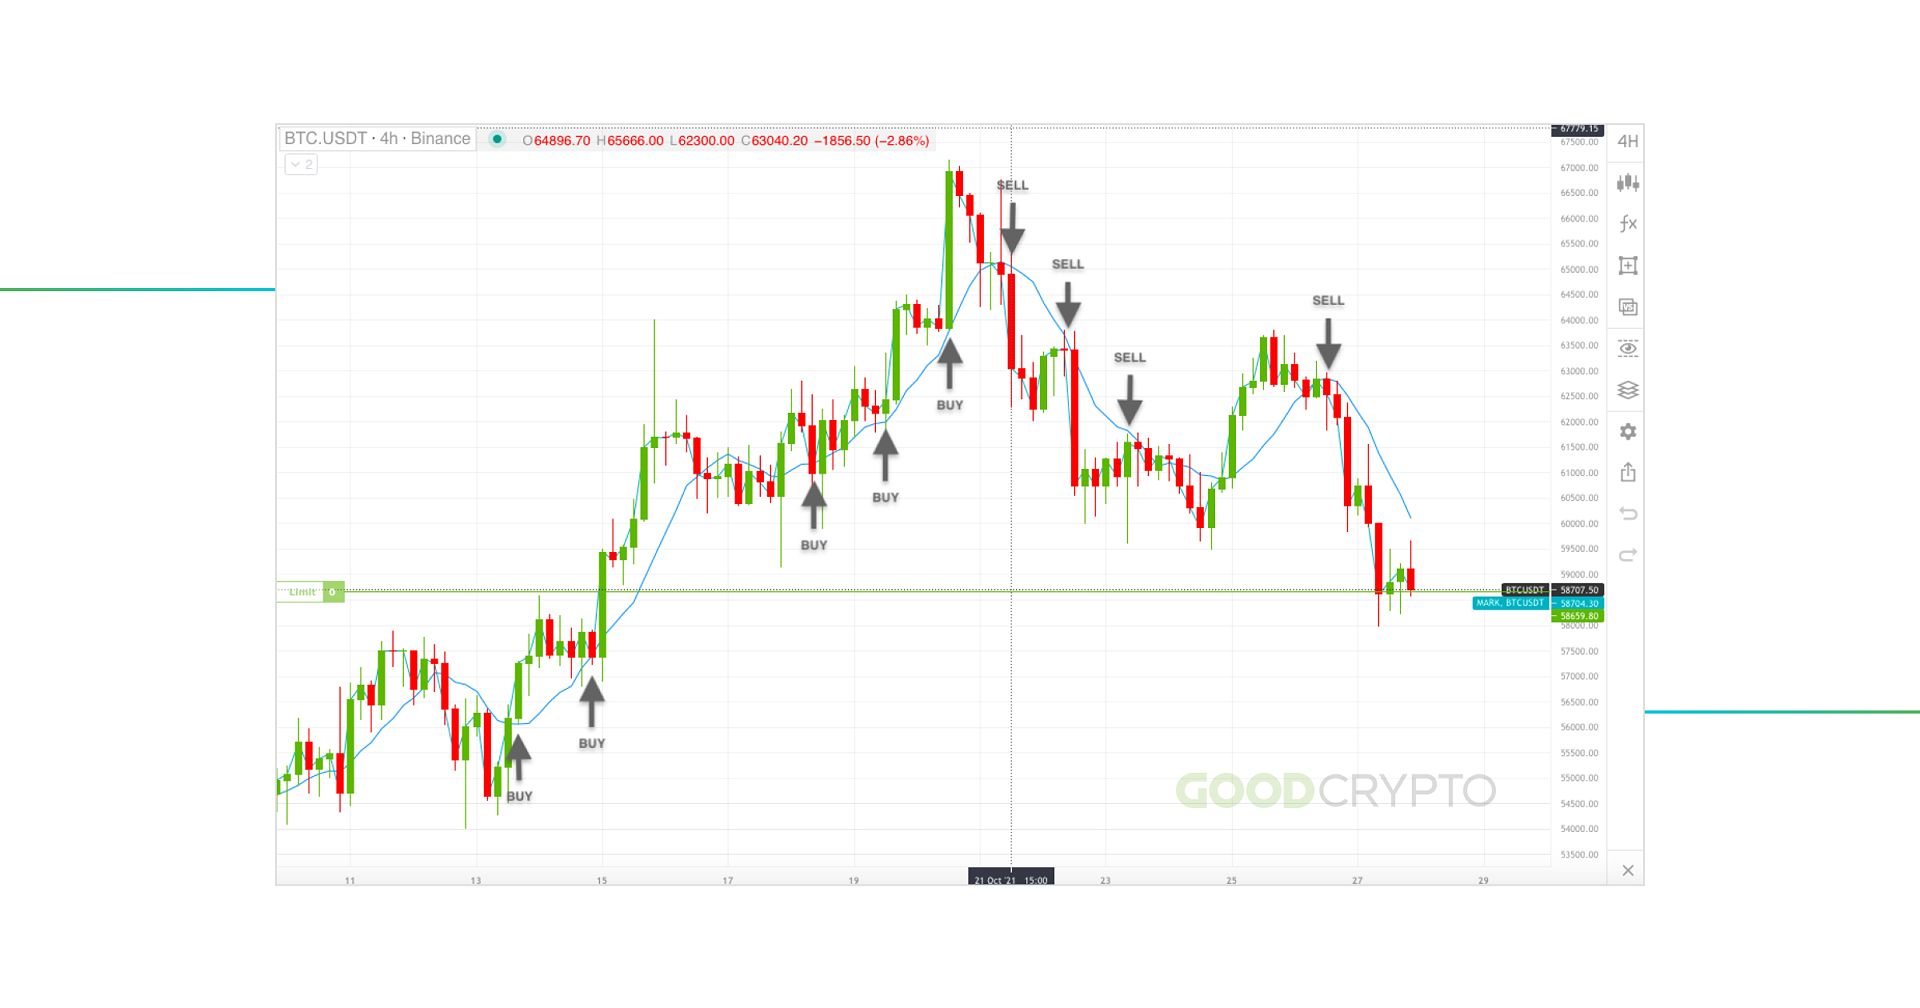 Moving Average Indicator Image: ‘buy’ and ‘sell’ signals on Moving Average Indicator
You can choose between a simple moving average (SMA) or an exponential moving average (EMA), each with its own unique characteristics. The “Golden Cross” (when the shorter MA crosses above the longer MA) and the “Death Cross” (when the shorter MA crosses below the longer MA) are widely recognized signals of potential trend reversals. MAs can also act as dynamic support and resistance levels, guiding your entry and exit points.
I’ve found that incorporating MAs into my trading strategy has been instrumental in helping me make more informed decisions, particularly during periods of market volatility. By using multiple MAs with varying time frames, I can gain a clearer understanding of the market’s overall momentum and adjust my positions accordingly.
Relative Strength Index (RSI): Gauging Momentum and Potential Reversals
The Relative Strength Index (RSI) is a momentum oscillator that has become an indispensable tool in my crypto trading arsenal. This indicator measures the speed and change of price movements, fluctuating between 0 and 100, with readings above 70 indicating an overbought condition and readings below 30 suggesting an oversold condition.
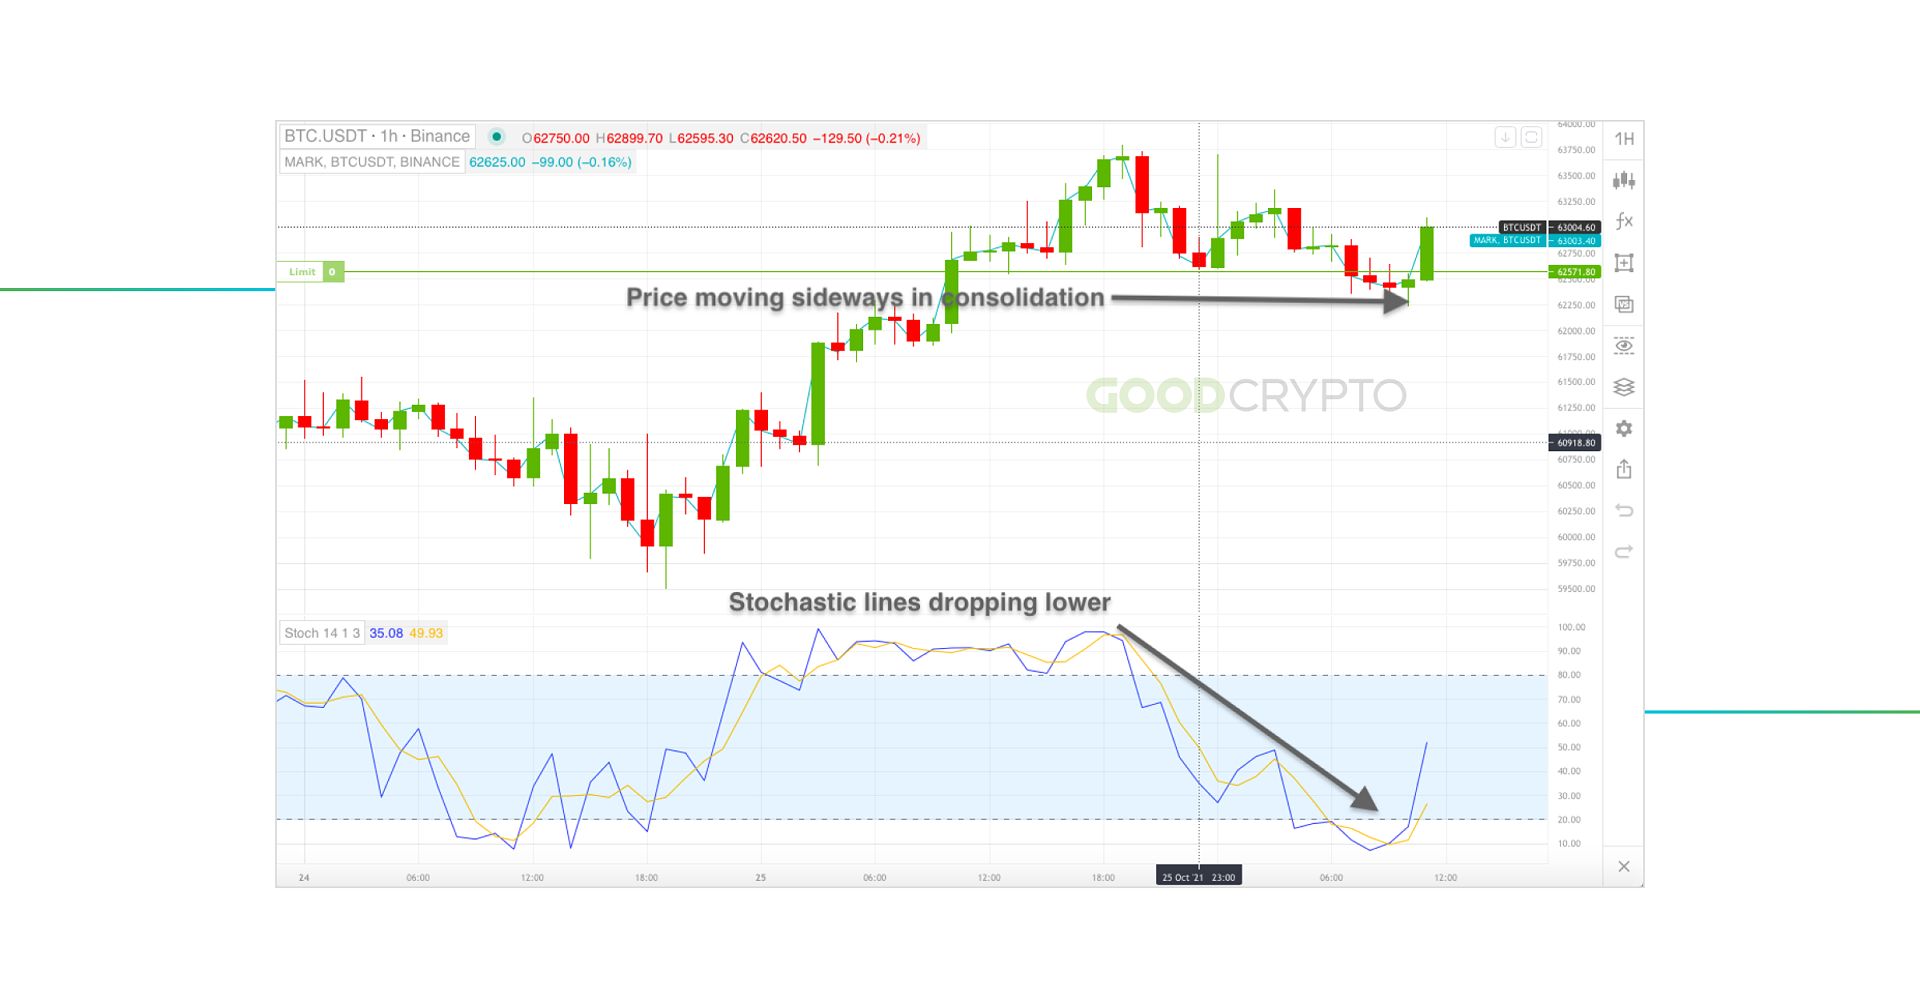 RSI Indicator Image: Stochastic Indicator
By closely monitoring the RSI, I can identify potential trend reversals and manage my risk more effectively. Additionally, I’ve found that divergences between the RSI and the price can provide early signals of an impending trend change, allowing me to act proactively and capitalize on emerging opportunities.
The RSI’s ability to gauge momentum has been particularly valuable in the highly volatile crypto market, where sudden price swings can catch even the most seasoned traders off guard. By incorporating the RSI into my trading strategy, I’ve been able to make more informed decisions and avoid being swept up in the emotional rollercoaster that can sometimes accompany crypto trading.
MACD: Navigating Momentum and Trend Changes with Confidence
The Moving Average Convergence Divergence (MACD) is a powerful combination of trend-following and momentum indicators that I’ve come to rely on heavily in my crypto trading journey. This indicator consists of the MACD line, the signal line, and the histogram, each providing valuable insights into the market’s underlying dynamics.
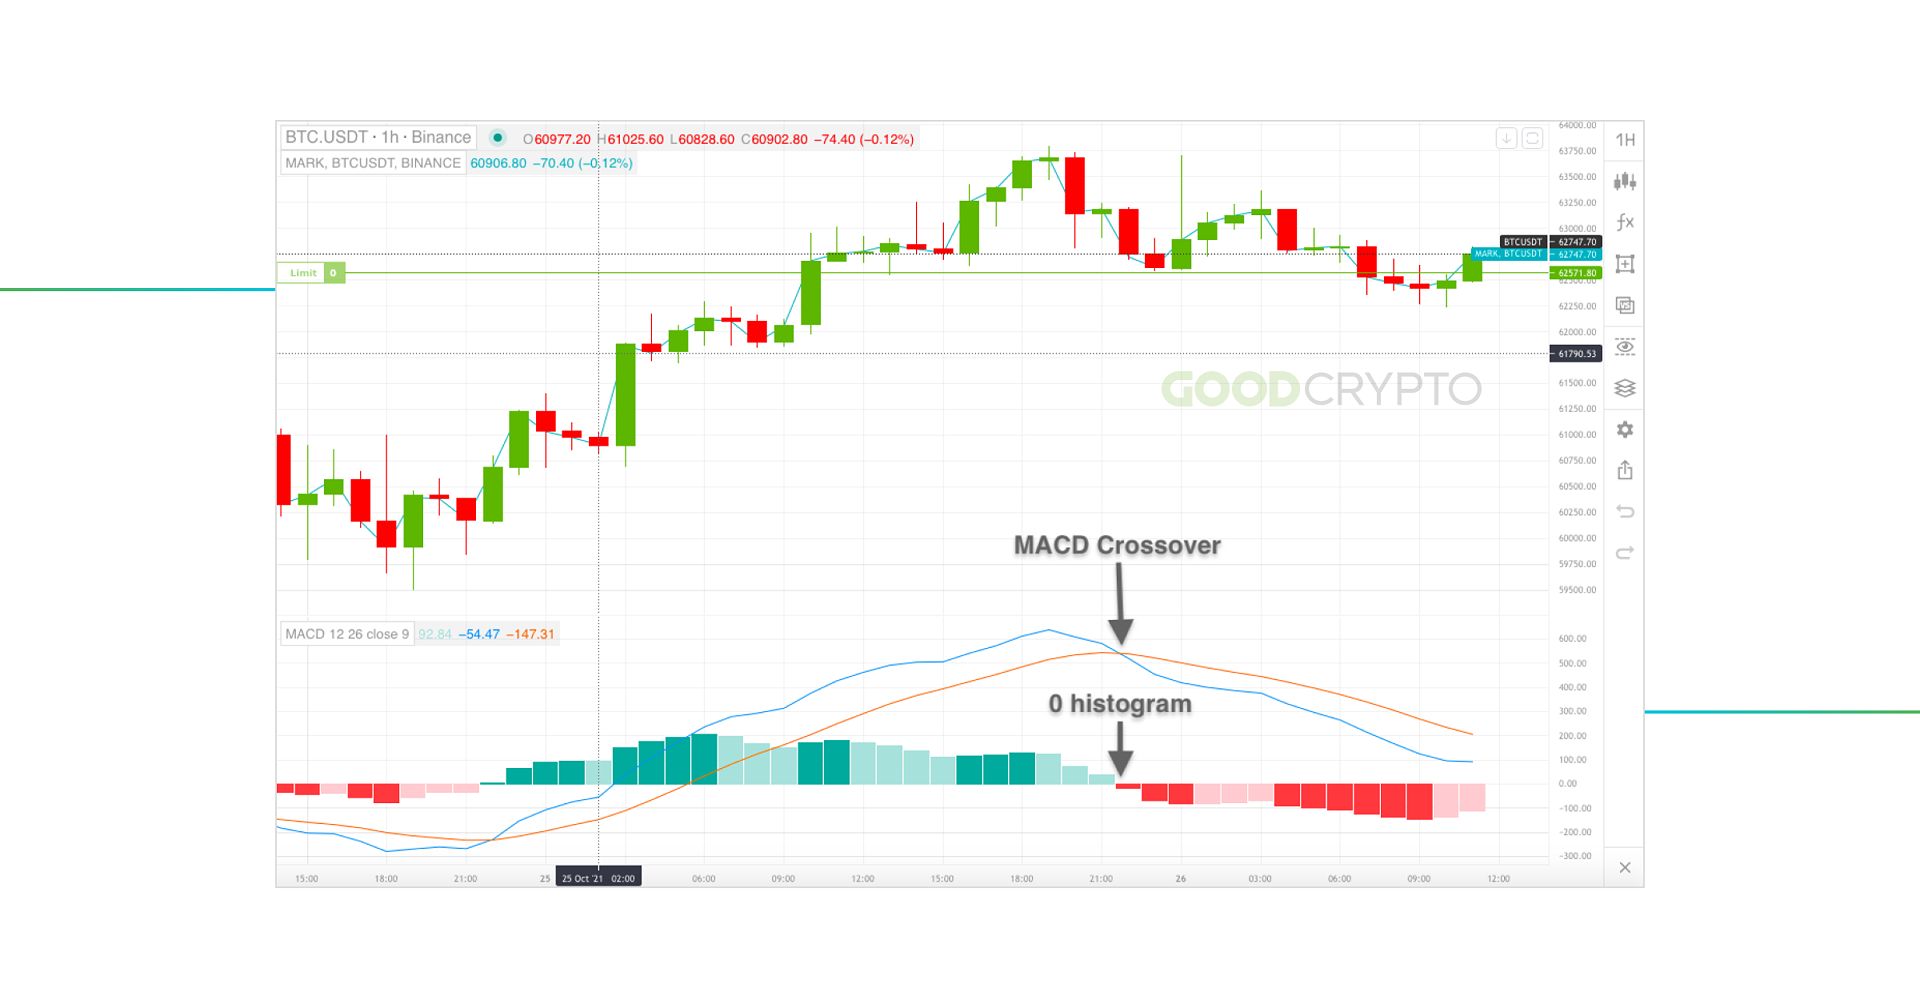 MACD Crossover Image: MACD crossover
MACD crossovers and histogram divergences can be used to detect changes in the market’s momentum and identify potential trend reversals. I’ve found that the MACD is a versatile indicator that can help me identify both short-term and long-term market trends, making it an invaluable tool in my crypto trading toolbox.
By analyzing the MACD in conjunction with other indicators, I’m able to confirm trading signals and make more informed decisions, whether I’m looking to capitalize on short-term price movements or position myself for longer-term market shifts.
Bollinger Bands: Measuring Volatility and Identifying Breakout Opportunities
Bollinger Bands are a volatility indicator that I’ve found to be particularly useful in the unpredictable world of cryptocurrency trading. Consisting of an upper band, a middle band (a simple moving average), and a lower band, the distance between the upper and lower bands expands during periods of high volatility and contracts during low-volatility periods.
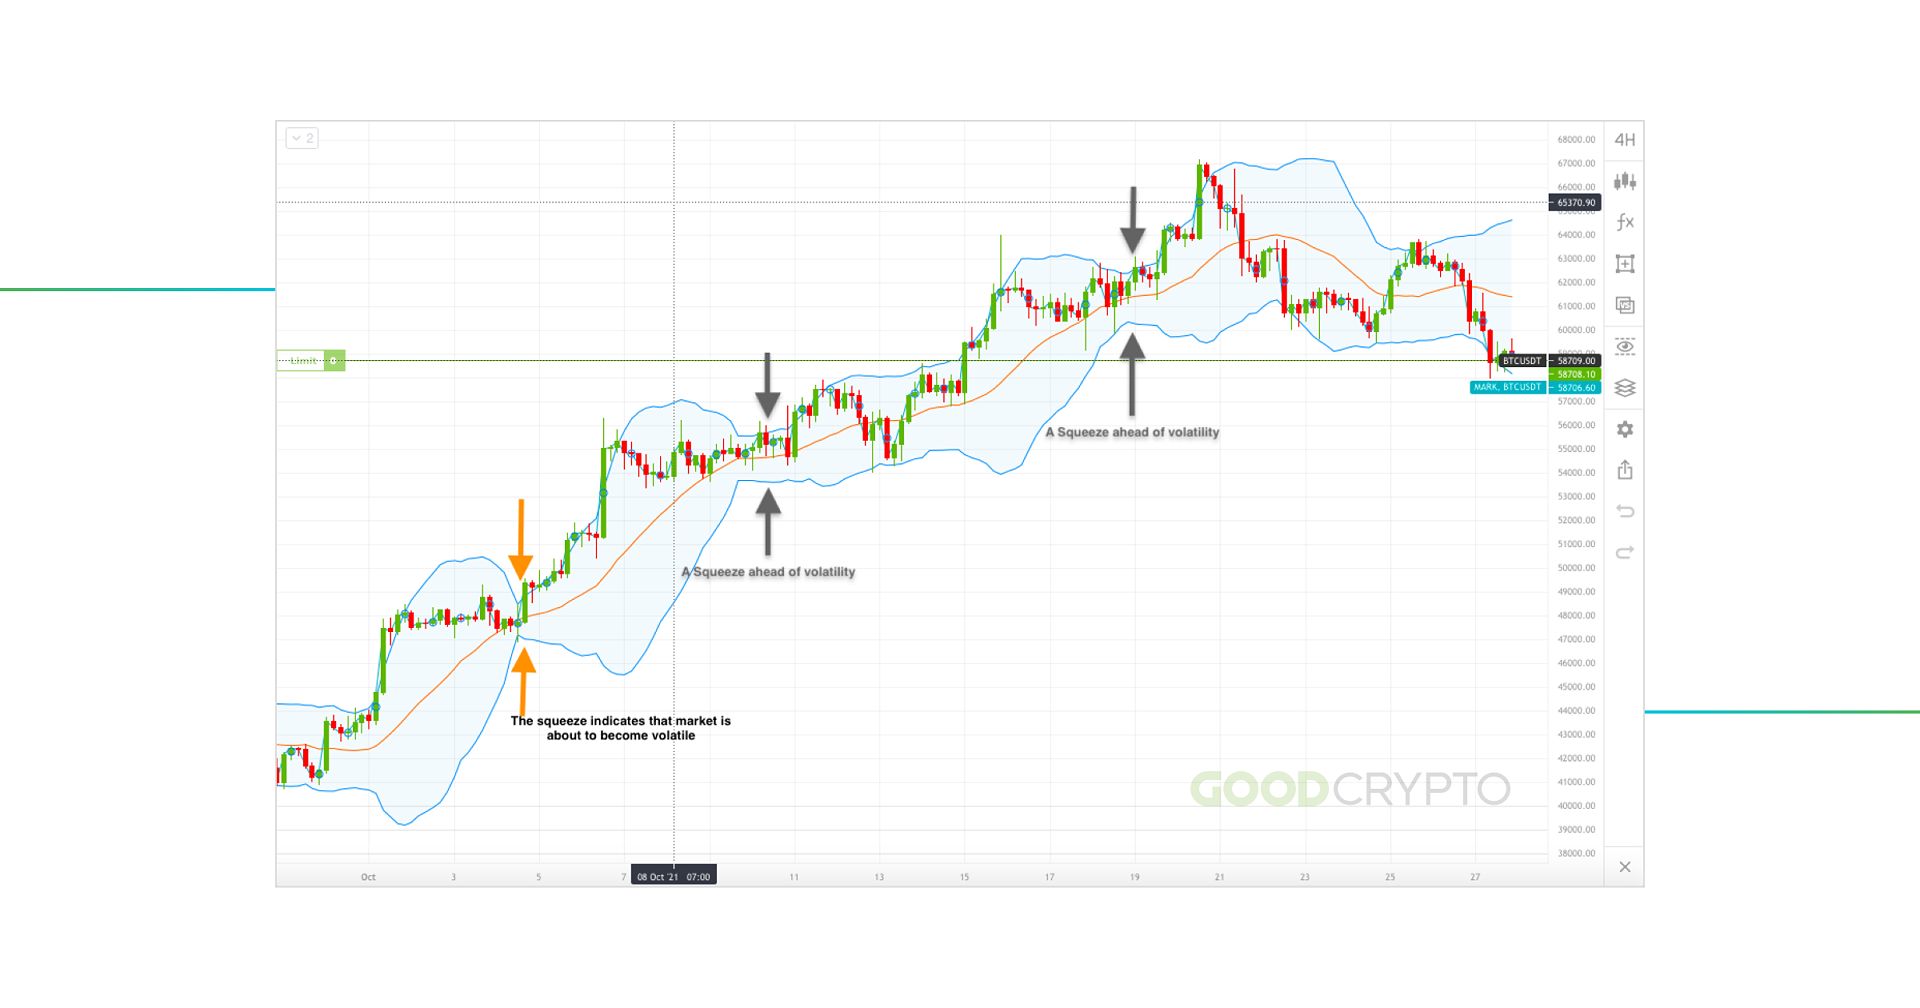 Bollinger Band Squeeze Image: Bollinger Band Squeeze
I keep a close eye on “Bollinger Band squeezes” (when the bands contract) as a signal of an impending breakout, and “Bollinger Band bounces” (when the price touches one of the bands) as potential reversal points. By incorporating Bollinger Bands into my trading strategy, I’ve been able to better navigate the market’s fluctuations and identify opportunities to enter or exit positions at opportune moments.
While Bollinger Bands shouldn’t be relied upon as a standalone indicator, I’ve found that they complement my other technical analysis tools remarkably well, helping me make more informed and well-rounded trading decisions.
Fibonacci Retracement: Predicting Support and Resistance Levels
The Fibonacci Retracement is a tool that I’ve come to rely on heavily in my crypto trading journey, as it helps me identify potential support and resistance levels based on the Fibonacci sequence. These levels, represented by horizontal lines, are drawn between a swing high and a swing low, indicating where the price might find support or resistance.
The Fibonacci Retracement levels (23.6%, 38.2%, 61.8%, and 78.6%) have proven invaluable in helping me predict potential price reversals and set appropriate profit targets. By incorporating this indicator into my trading strategy, I’ve been able to make more informed decisions and enhance my overall risk management approach.
While the Fibonacci Retracement may require a bit more practice and understanding to master, I’ve found that it’s a powerful tool that can provide valuable insights into the market’s underlying dynamics, especially when used in conjunction with other technical indicators.
Elevating Your Crypto Trading Strategy: Mastering Indicator Combinations
While each of the indicators I’ve discussed can provide valuable insights on their own, the true power lies in using them in combination. By analyzing multiple indicators simultaneously, you can confirm trading signals, identify potential divergences, and make more well-rounded decisions.
For example, I might use the Moving Average to determine the overall trend direction, coupled with the Relative Strength Index to assess the momentum and overbought/oversold conditions. Additionally, incorporating the MACD to identify changes in momentum can further validate my trading decisions.
Experimenting with different indicator combinations and backtesting your strategies can help you develop a comprehensive and robust trading approach, tailored to your personal trading style and risk tolerance. Remember, the key is to start simple, gradually incorporate more indicators, and continuously refine your strategy based on your performance and market conditions.
Navigating the Crypto Landscape: Additional Tips for Beginner Success
While mastering the best crypto trading indicators is a crucial step in your trading journey, it’s important to remember that these tools are just one piece of the puzzle. To further enhance your crypto trading strategy, consider the following tips:
- Diversify Your Portfolio: Don’t put all your eggs in one basket. Diversify your cryptocurrency investments to mitigate risks and potentially increase your overall returns.
- Stay Informed: Keep up with the latest news, developments, and regulations in the crypto industry. This can help you make more informed trading decisions and adapt your strategy accordingly.
- Practice Patience: Cryptocurrency trading can be a roller coaster ride. Maintain discipline, avoid impulsive decisions, and be patient when waiting for the right trading opportunities.
- Continuously Learn and Improve: The crypto market is constantly evolving, so be prepared to adapt your trading approach and expand your knowledge. Engage in ongoing education, attend webinars, and seek guidance from experienced traders.
- Manage Your Risks: Cryptocurrency trading involves inherent risks. Implement robust risk management strategies, such as setting stop-loss orders and diversifying your portfolio, to protect your capital.
FQAs: Addressing Common Crypto Trading Indicator Questions
Q: What are the best indicators for day trading crypto? A: For day trading, indicators like RSI, MACD, and Bollinger Bands can be particularly useful for identifying short-term trends and momentum changes.
Q: Can I use the same indicators for different cryptocurrencies? A: Yes, you can use the same indicators for different cryptocurrencies, but remember that market dynamics can vary, so you may need to adjust your settings accordingly.
Q: Are indicators always accurate? A: Indicators are tools, not guarantees. They can provide valuable insights, but they are not foolproof. Always use them in combination with other analysis techniques and manage your risk accordingly.
Q: How can I determine the right settings for each indicator? A: The optimal indicator settings often depend on the cryptocurrency, timeframe, and your trading style. Experiment with different settings and backtest your strategies to find the combination that works best for your needs.
Unlocking Your Crypto Trading Potential
As I reflect on my own crypto trading journey, I’m reminded of the transformative power of the best trading indicators. By understanding and effectively utilizing these tools, I’ve been able to navigate the volatile cryptocurrency market with greater confidence and success.
Whether you’re a day trader seeking short-term opportunities or a long-term investor aiming to capitalize on emerging trends, mastering the top 5 crypto trading indicators can be a game-changer in your trading approach. Remember to start simple, experiment with different combinations, and continuously refine your strategy based on your performance and market conditions.
Embrace the power of these indicators, stay informed, and manage your risks effectively. With dedication and the right tools, you too can unlock the full potential of the cryptocurrency market and embark on a rewarding trading journey. Happy trading!

